How to Read Crypto Charts – A Beginner’s Guide
Key Takeaways
- Crypto trading charts, such as line charts, bar charts, and candlestick charts, show how crypto prices and other information change over time.
- Understanding how to read cryptocurrency charts is essential for analyzing trends and determining price movements.
- Popular overlays and indicators on live crypto charts help traders make informed decisions.
- Recognizing bullish and bearish patterns is crucial for successful crypto trading.
- Using multiple indicators and backtesting strategies can improve trading approaches.
Why Understanding Crypto Charts Matters
Crypto trading charts are vital for anyone looking to invest or trade in cryptocurrency. They provide a visual representation of market data, helping traders make informed decisions. By analyzing price movements and patterns, traders can identify market trends and anticipate future price directions.
Think of reading crypto charts as reading a map before embarking on a journey. Just as a map helps navigate through various routes, crypto charts help traders understand market trends and potential price movements.
Types of Crypto Charts
Line Charts
Line charts are the simplest type of trading charts. They plot a line from one closing price to the next over a specified period. These charts are useful for identifying general trends and long-term price movements but lack detailed intraday price fluctuations.
Bar Charts
Bar charts provide more details than line charts. Each bar represents a specific time period (e.g., one day, one hour) and displays the opening, closing, high, and low prices for that period. The top of the bar indicates the highest price, while the bottom represents the lowest. Small horizontal lines indicate the opening and closing prices.
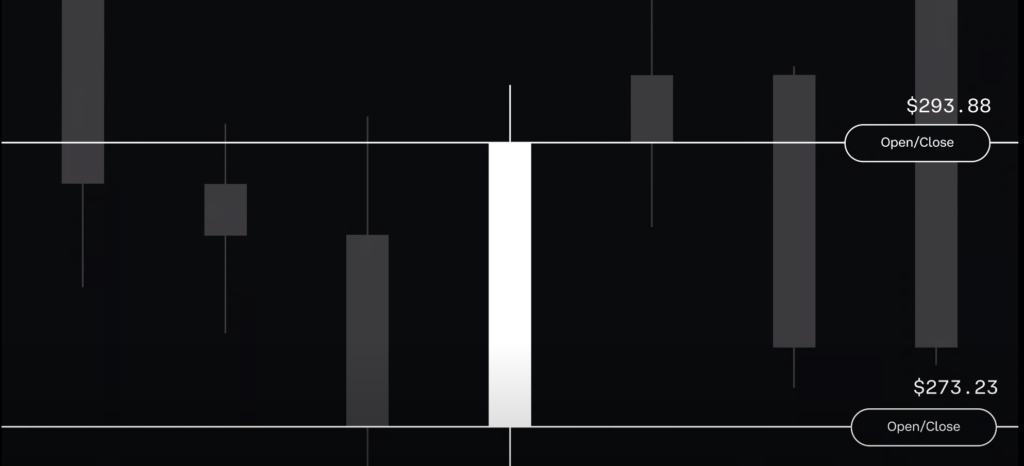
Candlestick Charts
Candlestick charts are the most popular and widely used charts in cryptocurrency trading. They provide the same information as bar charts but in a more visually intuitive format. Each candlestick represents a specific time period and shows the opening, closing, high, and low prices. Green candlesticks indicate upward movement, while red ones indicate downward movement.
Key Components of a Crypto Chart
Timeframes
The timeframe of a chart is essential, as it determines how much data is displayed. Common timeframes include one minute, five minutes, one hour, one day, and one week. Short-term traders prefer shorter timeframes, while long-term investors opt for broader perspectives.
Price Axis and Volume Axis
- Price Axis: The vertical axis on the right shows cryptocurrency price levels.
- Volume Axis: Displays trading volume, which indicates market activity and liquidity.
Crypto Chart Indicators and Overlays
Indicators and overlays enhance chart analysis. Overlays appear directly on the price chart, while indicators are displayed separately.
Popular Overlays
- Moving Averages (MA): Smooth out price data to identify trend direction.
- Bollinger Bands: Consist of a simple moving average and two outer bands indicating volatility.
- Fibonacci Retracement: Uses horizontal lines to indicate potential support and resistance levels.
Popular Indicators
- Relative Strength Index (RSI): Measures price movement speed to identify overbought or oversold conditions.
- Moving Average Convergence Divergence (MACD): A momentum indicator that helps identify trend direction.
- Stochastic Oscillator: Compares a closing price to a price range over a certain period to determine momentum.
Identifying Patterns in Crypto Charts
Recognizing chart patterns is crucial in technical analysis. Here are some common patterns:
Head-and-Shoulders Pattern
This reversal pattern signals a change in trend direction. It consists of three peaks: a higher peak (head) and two lower peaks (shoulders). A break below the neckline confirms a bearish reversal.
Double Tops and Bottoms
- Double Top: Indicates a bearish reversal after an uptrend.
- Double Bottom: Suggests a bullish reversal after a downtrend.
Triangles
- Ascending Triangle: Indicates a bullish trend.
- Descending Triangle: Suggests a bearish trend.
- Symmetrical Triangle: Indicates a continuation of the current trend.
Practical Tips for Reading Crypto Charts
- Choose the Right Charting Platform: Platforms like TradingView and Binance provide comprehensive charting tools.
- Use Multiple Indicators: Combining different indicators enhances trading analysis.
- Customize Charts for Readability: Adjust colors, backgrounds, and gridlines to improve visibility.
- Develop a Systematic Approach: Follow a checklist for analyzing charts.
- Backtest Strategies with Historical Data: Test trading strategies using past market conditions before applying them in live trading.
By mastering these techniques, traders can gain valuable insights into price movements, enhancing their crypto trading strategies.